
What Is the Price-to-Earnings (P/E) Ratio?
The price-to-earnings (P/E) ratio or price multiple is used to derive the valuation of the company by dividing the company’s share price by earnings per share.
As a stock valuation metric, the price-to-earnings (P/E) ratio is helpful in comparisons within an industry group with similar companies.
[ez-toc]
A business’s stock price can be overvalued or undervalued, depending on the price that the investor is willing to pay, but the price-to-earnings (P/E) ratio will help to discover the actual value of that particular stock’s current price.
An investor or a stock analyst considers a range of metrics along with the stock’s price-to-earnings (P/E) ratio to determine the correct valuation. Other metrics are the industry trends, stock market or index performance, the company’s business model, macroeconomic conditions, etc. It is also helpful in decision-making in investment banking.
A price-earnings ratio can be calculated for historic cost, i.e. backward-looking to measure the company’s past performance, it is called, the trailing p e ratio. It can be calculated for earnings yields the previous four quarters. The forward price-earnings ratio can also be calculated for future earnings projections spanning over 12 calendar months.
Significance of Price-Earnings Ratio (P-E Ratio)
The P/E ratio or earnings multiple ratio reflects market confidence in a company. When investors look at a company’s P/E ratio, they’re essentially seeing how much faith the market has in the company’s past or future anticipated earnings growth. The price-earnings ratio helps to understand market trends and investor sentiment.
A high P/E ratio often signals that investors expect higher earnings growth in the future compared to companies with a lower P/E ratio.
A lower P/E ratio might indicate that a stock is undervalued by current earnings, potentially making it a hidden gem in the market, i.e. on buying an undervalued stock you can gain substantially when markets correct themselves giving huge profit margins.
Before investing in an undervalued growth stock, do check if the company is facing challenges, and the market doesn’t expect significant growth. This is where the P/E ratio becomes more than just a figure; it’s a starting point for deeper analysis.
For professional investors and analysts, the P/E ratio is a tool for comparing the relative value of companies within the same sector or the broader market.
In a bullish market, higher P/E ratios are common as investor optimism drives up stock prices. In contrast, bearish markets might see lower P/E ratios as investor confidence wanes higher stock’s price down.
Price to Earnings Ratio (P-E Ratio) Formula
Price-to-Earnings ratio also known as price multiple or earnings multiple is calculated by dividing the company’s stock prices by its earnings per share (EPS).
Price-to-Earnings ratio = Company’s stock price/ Company’s earnings per share (EPS)
The company’s stock price is the current market price of a single share.
The company’s earnings per share is essentially the company’s profit allocated to each outstanding share of its common stock. It’s a measure of the company’s financial health and profitability on a per-share basis.
The formula for calculating the company’s earnings per share is:
EPS = (Net Income−Dividends on Preferred Stock)​ divided by Average Outstanding Shares
- Net Income: This is the total profit of the company after all expenses and taxes have been deducted. It’s essentially the bottom line of the company’s income statement.
- Dividends on Preferred Stock: If the company has issued preferred shares, the dividends paid to these shareholders are subtracted from the net income. This step is necessary because EPS relates to earnings available to common stockholders.
- Average Outstanding Shares: This is the average number of shares that were outstanding during the period being analyzed. It’s important to use the average because the number of outstanding shares can fluctuate over time due to stock buybacks, issuance of new shares, etc.
(The EPS can be based on past earnings (twelve months trailing EPS or ttm earnings) or future projected earnings (forward EPS), depending on the relevant time period being considered.)
Variants of P/E Ratio
Forward P/E ratio
The Forward P/E Ratio is a forward-looking metric that evaluates a company’s valuation based on its forecasted earnings. It differs from the trailing P/E ratio by focusing on the company’s expected earnings growth rate rather than its past earnings.
To calculate the Forward P/E Ratio, divide the company’s current stock price by its estimated EPS for the upcoming 12 months. This estimation of EPS is typically based on analysts’ predictions and provides insight into the company’s future financial health.
The Forward P/E Ratio Formula = Company’s Current Stock Price divided by Forecasted EPS
Investors use the Forward PE Ratio to gauge a stock’s valuation in the context of its future earnings potential. A lower Forward PE might suggest that the stock is undervalued relative to its growth prospects. This ratio is particularly useful for growth stocks, where future earnings are expected to increase significantly, and helps in reaching an investment decision.
Trailing P/E ratio
The Trailing P/E Ratio is a backward-looking measure that assesses a company’s current stock prices against its earnings over the past 12 months. It reflects how the market values the company’s past performance.
The Trailing P/E Ratio is calculated by dividing the company’s current stock price by its EPS from the past year. This historical EPS is derived from the company’s actual earnings reported in the previous four quarters.
The Trailing P/E Ratio Formula = (Company’s Current Stock Price) divided by the Company’s Annual Earnings
This ratio is commonly used by investors to compare companies within the same industry or sector, providing a relative value based on past earnings. It’s a key indicator of how the market perceives a company’s past financial performance but may not always reflect future growth prospects.
The Shiller P/E Ratio
The Shiller P-E Ratio, also known as the Cyclically Adjusted Price-Earnings (CAPE) Ratio, takes a long-term view of a company’s valuation. It averages the current price to the company’s earnings over the past 10 years, adjusting for inflation, to smooth out short-term fluctuations.
To calculate the Shiller P/E Ratio, divide the company’s current stock prices by the average inflation-adjusted earnings of the past 10 years.
Shiller P/E Ratio Formula = Company’s current year stock price divided by 10 Year Average Real Earnings
The Shiller price-to-earnings ratio is for assessing long-term trends in stock valuation and identifying potential bubbles or undervaluations in the market. It offers a broader perspective on a company’s valuation, considering a decade’s worth of forward earnings and data.
Calculation and Examples of P-E Ratio
Example 1: Calculating price-earnings ratio for company’s Stock
- Stock price of $50,
- Net income = $2 million
- Outstanding shares = 1 million
Answer:
To calculate its P/E ratio, we first need to calculate its EPS.
EPS Calculation:
- Net Income: $2 million
- Outstanding Shares: 1 million
EPS = Net Income / Outstanding Shares = $2 million / 1 million = $2 per share
P/E Ratio Calculation:
- Stock Price: $50
- EPS: $2
P/E Ratio = Stock Price / EPS = $50 / $2 = 25
With a P/E ratio of 25, Company X is trading at 25 times its earnings. If the industry average is around 20 and Company X has strong growth prospects, it might be a good investment despite the higher price.
Example 2: Comparing Stock A and Stock B
Which stock is a better investment, Stock A with a price of $100 and net income of $5 million, or Stock B with a price of $80 and net income of $3 million? Both have 1 million outstanding shares.
Answer:
Stock A Calculation:
- EPS: $5
- P/E Ratio: 20
Stock B Calculation:
- EPS: $3
- P/E Ratio: 26.67
Stock A has a lower P/E ratio, suggesting it might be undervalued compared to Stock B. If both companies are in the same sector, an investor might lean towards Stock A for its lower valuation and potential for growth.
Example 3: Forward P/E Ratio for Stock A and Stock B
Stock A Forward P/E Ratio Calculation:
- Current Stock Price: $100
- Forecasted EPS for next year: $6
- Forward P/E Ratio = Current Stock Price / Forecasted EPS
- Calculation: $100 / $6 = 16.67
Stock B Forward P/E Ratio Calculation:
- Current Stock Price: $80
- Forecasted EPS for next year: $4
- Forward P/E Ratio = Current Stock Price / Forecasted EPS
- Calculation: $80 / $4 = 20
Stock A, with a lower forward P/E ratio of 16.67, suggests better growth potential compared to Stock B’s 20. This indicates that Stock A might be a more attractive investment option.
Example 4: Valuation of Company A and Company B.
Assumptions:
Company A is a part of the same industry and stock index as Company B and has consistent earnings growth and no history of negative earnings. While company B, has a history of negative earnings too.
Company A Valuation:
- Assuming a current stock price of $120 and forecasted EPS of $8.
- Forward P/E Ratio = Current Stock Price / Forecasted EPS
- Calculation: $120 / $8 = 15
Company B Valuation:
- Assume a current stock price of $90 and a forecasted EPS of $5.
- Forward P/E Ratio = Current Stock Price / Forecasted EPS
- Calculation: $90 / $5 = 18
Company A, with a lower forward P/E ratio of 15, suggests a more favorable valuation and stable growth prospects compared to Company B’s higher ratio of 18. This analysis indicates that Company A may be a more secure and potentially profitable investment.
Interpretation of P/E Ratio
Creditors Perspective
From a creditor’s viewpoint, the P/E ratio signifies a company’s investment risk.
A high P/E ratio may suggest that the company’s stock price is somewhat overvalued compared to its earnings, signaling a higher risk for creditors.
A low P/E ratio could indicate either an undervalued stock or potential financial troubles within the company.
Stability or improvement in the P/E ratio over a specified time period is usually seen as a positive sign.
Professional Investors Perspective
Professional investors leverage the price-to-earnings ratios to determine whether a stock is overvalued or undervalued in the market. Platforms like Yahoo Finance, Bloomberg, etc. are often referenced to compare P/E ratios within the same industry, aiding investors in making informed decisions.
A high P/E ratio can attract growth-oriented investors who are willing to pay higher prices for stocks, anticipating significant future earnings growth.
Value investors might focus on stocks with lower price-to-earnings ratios, seeing them as undervalued opportunities. The p e ratios help in shaping long-term investment strategies, and maintaining a portfolio with appropriately valued stocks is a step towards achieving financial freedom.
Internal Management’s Perspective
For a company’s internal management, the price-to-earnings ratios are an essential barometer of market perception. P E ratios play a significant role in investor relations.
The p e ratios can influence key strategic business decisions, especially for publicly traded companies. If a price-to-earnings ratio is low, management might consider strategies to boost profitability or restructure operations to enhance investor confidence.
A high price-to-earnings ratio could signal a favorable market perception, attracting capital and investments.
Uses of P/E Ratio
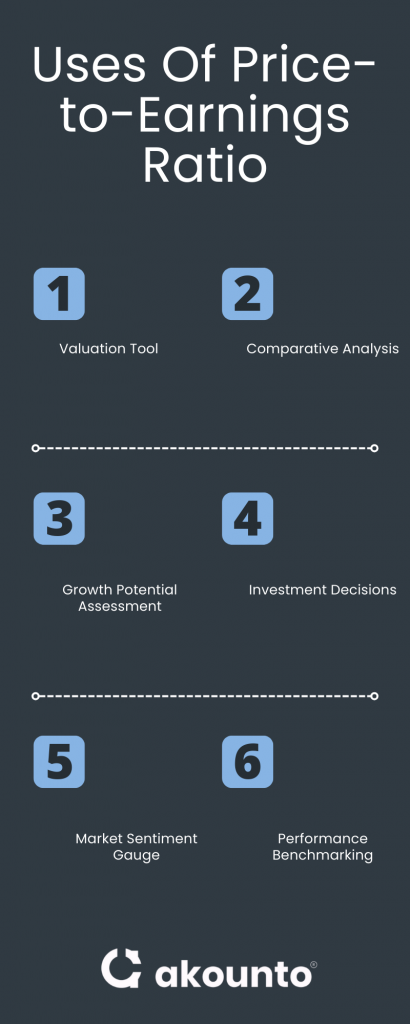
- Valuation Tool: The price-to-earning ratio helps to assess a company’s market valuation, helping investors determine if a stock is priced relative to its earnings or not.
- Comparative Analysis: Investors and analysts use the P/E ratio to compare companies within the same industry, providing a basis for evaluating relative stock values.
- Growth Potential Assessment: A higher P/E ratio often indicates that investors expect higher future earnings growth, making it a useful metric for identifying potential growth stocks.
- Investment Decisions: The P/E ratio aids in making informed investment decisions, helping investors choose stocks that align with their investment strategies and risk tolerance.
- Market Sentiment Gauge: It serves as an indicator of market sentiment, with high P/E ratios reflecting optimism about a company’s future prospects and low ratios potentially indicating undervaluation or skepticism.
- Performance Benchmarking: Companies use the P/E ratio to benchmark their performance against peers, guiding strategic decisions and investor communication strategies.
Conclusion
As an investor losing money is surely a nightmare and one tends to avoid it at all costs. Studying a company’s past or future earnings is helpful in a manner to understand its growth pattern. Getting swayed by higher stock prices in anticipation of better future results is surely a recipe for losing money. Many investors focus on the EPS, PE Ratio, earnings yield, industry trends, and fundamental analysis to analyze the growth rate of a stock in future.
Learn more about finance, accounting, and bookkeeping from Akounto’s blogs to manage your business like a finance pro.