
Defining Margin of Error
The margin of error means the probable difference between the survey results and the actual value. Survey results cannot be 100% accurate, because the surveyor is trying to gather information about the whole population set from a limited sample, so there can be a certain degree of variations.
[ez-toc]
How much confidence one can have in survey results, is shown by the margin of error.
In business, market research and surveys become the basic inputs for decision-making, so calculating the margin of error is needed to establish the reliability and confidence in the survey findings.
The margin of error also known as sampling error is a statistical tool, which is used in relation to surveys, research, hypothesis testing, etc., when used in a non-survey context, then it gives, “observational error.”
The margin of error is usually expressed as a positive or negative percentage point, for example, there is 5% margin of error or 2% margin of error. In case there is a 2% margin of error, then there can be a 98% confidence level or confidence interval.
If the margin of error is large the confidence interval or level will be less. The lower the margin of error, the better it is, similarly, the higher the confidence interval, the more likely the sample population will accurately reflect the entire population.
The Margin of Error in Accounting
It is used to assess the accuracy of financial estimates and forecasts, providing a range within which the actual figures are expected to fall. For instance, when projecting future sales or expenses, accountants may calculate a margin of error to represent the degree of uncertainty in their estimates. This allows businesses to plan effectively, considering potential variations in financial outcomes.
Importance of Margin of Error
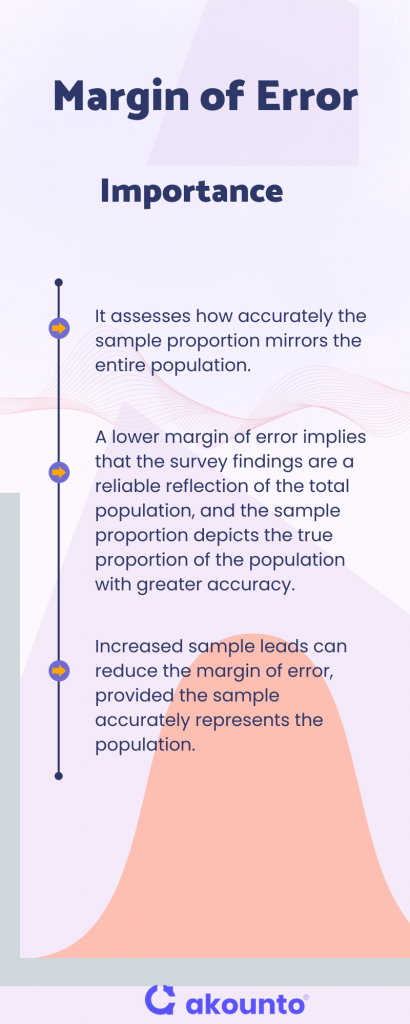
The margin of error is a vital statistical tool that estimates the precision of results, delineating the interval within which the actual population parameter is likely to reside. This becomes particularly crucial when working with sample data, as it assesses how accurately the sample proportion mirrors the entire population.
A lower margin of error signifies a higher degree of precision, implying that the survey findings are a reliable reflection of the total population and the sample proportion depicts the true proportion of the population with greater accuracy.
A larger margin of error indicates a broader range of uncertainty in the outcomes.
The margin of error is impacted by elements such as the sample size and the standard deviation. Generally, an increased sample leads to a reduced margin of error, provided the sample accurately represents the population.
A larger standard deviation, which signifies greater data variability, can inflate the margin of error.
By employing a margin of error calculator, investigators can determine the accuracy, thereby enhancing the reliability of their findings.
Understanding Confidence Level
The concept of a confidence level is closely tied to the margin of error in statistical analysis. It represents the degree of certainty that the actual value of a population parameter lies within a specified range, known as the confidence interval. The confidence level is typically computed as a percentage, with common levels being 90%, 95%, and 99%.
A higher confidence level suggests greater certainty that the confidence interval retains the true population parameter. However, it’s important to note that a higher confidence level also results in a wider confidence interval and a larger margin of error. This is because we must allow for more potential values within that range to be more confident that the interval contains the true parameter.
Understanding the confidence level is crucial in fields like investment banking, where decisions are often based on a statistical market data analysis. It helps quantify the level of uncertainty in estimates and forecasts, allowing for more informed decision-making.
For instance, if a survey of respondents from a target market results in a 95% confidence level, it means that if the same survey were conducted 100 times, the results would fall around the confidence interval in 95 out of 100 cases. This understanding can help businesses gauge the reliability of their survey results and make decisions accordingly.
Calculation
The calculation of the margin of error is a crucial step in statistical analysis. It involves using a specific formula that considers sample size, standard deviation, and z-score, corresponding to the chosen confidence level.
Margin of Error Formula
The formula for the margin of error is calculated by multiplying the z-score (a critical factor for a certain confidence level) with the population’s standard deviation. This result is then divided by the square root of the number of observations in the sample. Mathematically, it is represented as:
The margin of error formula = Z * Пѓ / в€љn
where: Z = z-score (critical factor)
Пѓ = standard deviation
n = total number of observations in the given sample
Extended Formula
Sometimes, the sample standard deviation can be used as an estimate when the population standard deviation is unknown. The formula then becomes:
The margin of Error Formula = Z * s / в€љn
where: s = sample standard deviation
Practical Examples
Example 1: A market research firm surveys with a sample size of 100 respondents. The standard deviation of the responses is 15, and they choose a 95% confidence level (Z=1.96). Calculate the margin using a margin of error formula.
The margin of error would be 1.96 * 15 / в€љ100 = 2.94. This means that the true population parameter will likely be within 2.94 units of the sample estimate.
Example 2:
An investment banking firm analyzes a portfolio’s return on investment (ROI) with a sample of 200 investments. The sample standard deviation is 20%, and they choose a 99% confidence level (Z=2.58). Calculate the margin of error using the error formula.
Following formula for margin of error = 2.58 * 20% / в€љ200 = 3.65%.
This means the true ROI will likely be within 3.65% of the sample estimate, per the margin of error calculated above.
Example 3: A company conducts an employee satisfaction survey with a sample of 500 employees. The standard deviation of the responses is 0.5, and they choose a 90% confidence level (Z=1.645). Show margin of error calculation.
Following margin of error formula = 1.645 * 0.5 / в€љ500 = 0.037.
According to the margin of error calculated above, the true employee satisfaction level will likely be within 0.037 units of the sample estimate.
Factors Affecting Sampling Error
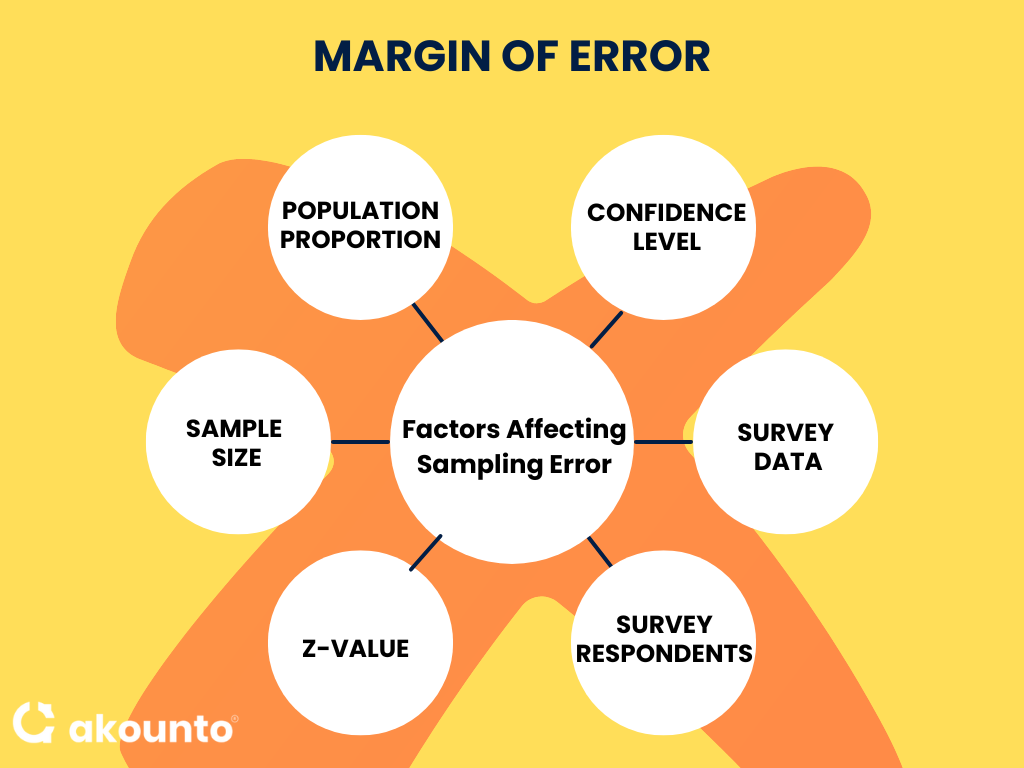
Sample Size
The sample size, denoted by ‘n,’ is a significant factor in determining the margin of error. With the increase in the sample, the error margin decreases, assuming all other factors remain constant. A larger sample size accurately represents the entire population, reducing the likelihood of error. Increasing the size yields diminishing returns in reducing the margin error after a certain point.
Population Proportion
The population proportion, denoted by ‘p,’ also influences the margin of error. When the population proportion is 0.5 (50%), the error margin is maximized. This is because a 50-50 split represents the highest level of uncertainty. As the proportion moves away from 0.5, the margin error decreases.
Confidence Level
The confidence level, represented by the z-score, is another crucial factor. A higher confidence level increases the margin of error and vice versa. For instance, a 99% confidence level (Z=2.58) will lead to a higher margin of error as compared to a 95% confidence level (Z=1.96). A higher confidence level requires a wider interval to capture the true population parameter with the stated confidence level.
Survey Data
The nature of the survey data can also impact the sampling error. For example, if the data is skewed or has outliers, it may increase the margin error. Using appropriate statistical techniques to handle such data is essential to ensure accurate results.
Survey Respondents
The characteristics of survey respondents can also affect the margin error. If the sample does not represent the population, it can lead to a high sampling error. This is why using a random sampling method to select survey respondents is crucial.
Z-Value
The Z-value, which corresponds to the chosen confidence level, is a critical factor in the margin of error calculation. A higher Z-value increases the sampling error, reflecting a wider range of potential values for the population parameter. Conversely, a lower Z-value results in a smaller margin of error, indicating a narrower range of potential values.
Conclusion
The margin of error estimates the accuracy of survey results, helping businesses make informed decisions. By considering factors such as sample size, population proportion, and confidence level, one can effectively manage the sampling error and enhance the reliability of their findings.
Sign Up with Akounto and get started with professional accounting services today!