

What is Break Even Point?
A business’s break-even point is when the total revenue and total costs are equal, creating a situation of no profit or loss, and all the costs are covered.
What’s covered in the article
Break-even analysis helps the company determine the minimum sales level to cover all the costs. In cost accounting, break-even analysis helps small businesses to conduct Cost-Volume-Profit (CVP) analysis, which examines the relationship between costs, volume, and profit.
It helps determine the impact of sales volume, pricing, or cost changes on the company’s financial performance. CVP can also be used to build scenarios to evaluate a business idea and determine if changes in the average selling price could be made without losing money.
The BEP is a practical tool used in business decision-making and an indispensable part of financial calculation as it guides the pricing strategy, sets realistic financial projections, tracks the effectiveness of sales dollars, and even secures funding.
Break-even analysis tells the amount of sales dollars to be generated to cover all the costs. A company can also calculate the break-even point in units produced to cover the costs.
Break-even analysis helps a small business to set a benchmark for when a business or investment becomes profitable, helping to guide strategic decision-making and financial planning.
Need and Significance of BEP in Cost Accounting
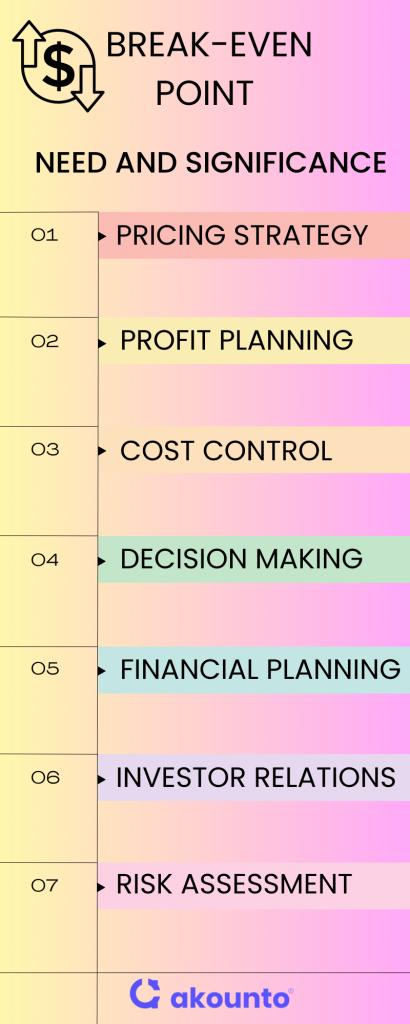
- Financial Planning: Break-even point helps businesses determine how many units of products must be sold to cover all the costs, thus setting sales targets and pricing strategies.
- Cost Control: Understanding the BEP allows businesses to manage and control their costs better. By knowing how many units need to be sold to cover costs, businesses can strategize on reducing variable costs or fixed costs to lower the BEP.
- Risk Assessment: BEP analysis provides insight into the risk level of a business. A high BEP indicates a higher risk as it requires more sales to cover costs. Conversely, a lower BEP suggests less risk.
- Decision Making: BEP is a valuable metric in making various business decisions. It can guide businesses in launching a product, entering a new market, or investing in new equipment based on the projected BEP.
- Profit Planning: BEP is not just about avoiding losses; it’s also about planning for profits. Once the BEP is reached, all additional units sold contribute to profit. Therefore, understanding the BEP can help in setting realistic profit targets.
- Investor Relations: Investors and creditors often use BEP to assess the financial health of a new business. A lower BEP is generally seen as a positive signal, indicating the business can cover its costs with fewer sales.
- Pricing Strategy: BEP analysis can inform the pricing strategy of a business. If a company’s break-even point BEP is too high, it might indicate that the selling price is too low or the costs are too high.
Break Even Calculation
Break-Even Analysis Formula
Break-Even Point in Quantity = Fixed Costs / (Sales Price per Unit – Variable Cost Per Unit)
Fixed Costs do not change with varying output, the Sales Price per Unit is the selling price per unit to be charged to the customer, and Variable Cost per Unit is the variable cost incurred to produce or manufacture a single unit.
Contribution Margin = Sales Price per unit minus Variable Costs per unit
Break Even Point Examples
Let’s consider a few examples to understand this better:
Example 1:
Company A sells watches and has the following financial information:
Fixed costs like property taxes, a lease, and executive salaries, which add up to $100,000. The variable cost of producing one watch is $2 per unit. The watch is sold at a price of $12.
Calculate the break-even point.
Solution
To calculate the break-even point of Company A’s premium water bottle:
Using the break-even point formula, the Break Even Quantity = $100,000 / ($12 – $2) = 10,000
As per the fixed costs, variable costs, and selling price of the watches, Company A would need to sell 10,000 units of watches to break even.
Example 2:
Consider a small business that sells handmade candles. The fixed costs, including rent and salaries, amount to $5,000 monthly. Each candle is sold for $10, and the variable cost per candle (wax, wick, fragrance, etc.) is $3. Calculate the break-even point in units.
Solution
Break Even Quantity = $5,000 / ($10 – $3) = 714.29
So, the business must sell approximately 715 candles to cover costs and reach the break-even point.
Example 3:
A tech startup has fixed costs of $20,000 per month, including rent, utilities, and salaries. They sell a software subscription at $50 per user; the variable costs (server costs, support, etc.) per user are $10. Calculate the break-even point in units.
Using the break even point formula, Break Even Quantity = $20,000 / ($50 – $10) = 500
The startup needs to acquire 500 subscribers to its software to break even.
Break Even and Contribution Margin
The break-even point analysis and contribution margin are two interconnected concepts in cost accounting that help businesses make informed financial decisions.
The Contribution Margin is the revenue per unit sold that exceeds the variable costs of producing that unit. It’s calculated by subtracting the variable cost per unit from the selling price per unit. This margin is crucial as it covers fixed costs and profits.
The Break-Even Point is the point where total revenue equals total costs—fixed and variable. It’s the point where a business neither makes a profit nor incurs a loss and can be calculated in units where the total fixed costs are divided by the contribution margin per unit.
The relationship between the two is direct and significant. The higher the contribution margin, the fewer units a business needs to sell to reach its break-even point. Conversely, a lower contribution margin means that more units are to be sold to cover fixed costs and start making a profit.
The contribution margin is expressed as a percentage of the selling price. It provides insight into how changes in the selling price or variable costs per unit will affect the break-even point.
The Contribution Margin Ratio (CMR) is calculated using the following formula:
Contribution Margin Ratio Formula = (Sales Revenue – Variable Costs) / Sales Revenue
This ratio is expressed as a percentage and indicates the percentage of each sales dollar that contributes to covering fixed costs and generating profit.
Contribution Margin Ratio Calculations
Example 1: Suppose a company sells a product for $100, and the variable cost per unit is $60. Using the formula, the CMR would be:
CMR = ($100 – $60) / $100 = 0.40 or 40%
This means that 40 cents contribute to covering fixed costs and generating profit for each dollar of revenue.
Example 2: If another company sells a product for $200, and the variable cost per unit is $50, the CMR would be:
CMR = ($200 – $50) / $200 = 0.75 or 75%
In this case, 75 cents contribute to covering fixed costs and generating profit for each sales dollar.
Factors to Consider in Break-Even Analysis
When conducting a break-even analysis, several key factors should be taken into account:
- Fixed and Variable Costs: Fixed costs (FC) remain the same regardless of your output. Examples include rent, insurance, and base salaries. Variable costs (VC), on the other hand, change with the number of units produced or sold. These include materials, sales commissions, and direct labor costs.
- Sales Price: The price you sell your product or service impacts your break-even point. A higher sales price can reduce the number of units you need to sell to break even.
- Sales Volume: The number of units sold directly affects the break-even analysis. Higher sales volumes can help cover total expenses more quickly, lowering the break-even point.
- Pricing Strategy: Your pricing strategy can significantly impact your break-even point. If you can lower variable costs or raise prices, you can reach your break-even point faster.
- Lowering Costs: Look for ways to reduce both variable and fixed costs. This could involve negotiating better terms with suppliers, improving operational efficiency, or reducing overhead costs.
- Market Conditions: Market conditions, including competition, demand, and economic factors, can influence your sales price and volume, affecting your break-even point.
CVP Analysis
The Break-Even Point (BEP) and Cost-Volume-Profit (CVP) Analysis are interconnected concepts in cost accounting that help businesses make informed financial decisions.
BEP is the point at which total revenue equals total costs, indicating the position of no profit and no loss. It’s a critical metric for startups and small businesses as it provides a clear target for the minimum sales volume needed to avoid financial strain.
CVP Analysis is a broader concept that examines the relationship between cost, sales volume, and profit. It helps businesses understand how changes in variable costs, fixed costs, and sales volume impact their net profit. This analysis is particularly useful in making short-term business decisions and planning for initial investment.
Both BEP and CVP Analysis are essential tools for businesses. They provide valuable insights into the company’s financial commitments, the impact of changes in costs and sales on profits, and the necessary sales volume to cover fixed and additional costs.
Benefits
Financial Planning
Break-even analysis is a critical tool in financial planning. It helps businesses understand the sales volume needed to cover all costs, thereby avoiding losses. This helps manage startup costs, formulate an effective business plan, evaluate a business model, and help small businesses derive sales targets, which often operate on thin margins.
Pricing Strategy
The break-even point tells how many sales are needed to cover the expenses. This helps in determining the minimum price per unit that must be charged.
Investment Decisions
Investors and lenders often use break-even analysis to assess a business plan or a new business. A lower break-even point indicates a lower risk, making the business more attractive to investors.
Cost Control
Break-even analysis highlights the impact of cost structure on profitability. It can guide businesses in managing these costs more effectively to lower the break-even point.
Limitations of Break-Even Analysis
Over-Simplification
Break-even analysis assumes that all units are sold, costs are constant, and everything produced is sold. However, market conditions, competition, and customer preferences can lead to unsold inventory, fluctuating costs, and variable sales.
Ignoring Semi-Variable Costs
Break-even analysis typically categorizes costs as fixed or variable. However, some costs, like electricity and labor, can be semi-variable, changing with the production level and having a fixed component. There can be missing expenses and contingent expenses, which can impact the profit margin.
Limited Scope
Break-even analysis focuses on the short-term viability of a business. It does not consider other important factors like market trends, long-term growth prospects, and return on investment.
Inaccurate for Multiple Products
Calculating a single break-even point can be misleading when a company sells multiple products. Each product may have different prices, costs, and demand levels, which are not captured in a simple break-even analysis.
Tips to Lower Break Even Point
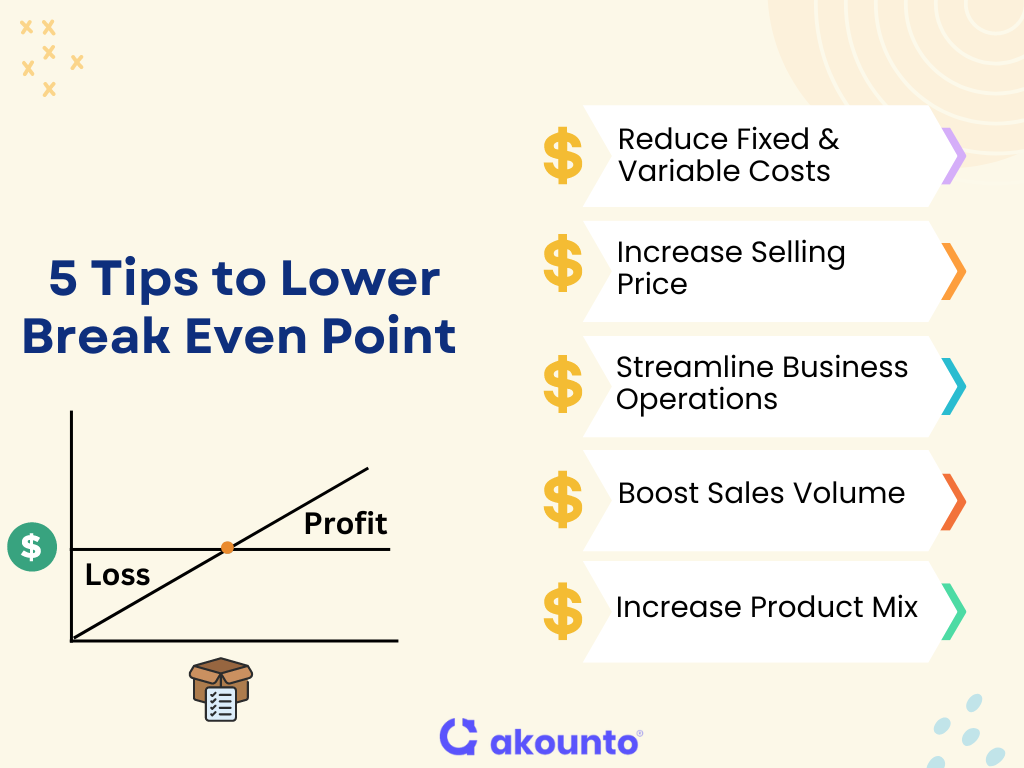
Reduce Fixed Costs
Lowering fixed costs such as rent, salaries, and utilities can directly lower the BEP. This might involve negotiating better terms with suppliers or landlords, outsourcing certain functions, or implementing energy-saving measures.
Increase Selling Price
If market conditions allow, increasing the selling price of your product or service can improve the contribution margin per unit, thus lowering the BEP. However, businesses must be careful not to price themselves out of the market.
Improve Operational Efficiency
Streamlining operations to reduce waste and increase productivity can lower variable costs. This might involve investing in more efficient equipment or training staff to improve their skills.
Boost Sales Volume
Increasing sales volume can distribute fixed costs over larger units, reducing the BEP. This might involve ramping up marketing efforts or expanding into new markets.
Product Mix
If a business sells multiple products, it can focus on selling more products with a higher contribution margin. This strategy can lower the overall BEP.
Outsourcing
Some businesses can reduce fixed and variable costs by outsourcing certain functions or processes. This strategy can be particularly effective for small businesses that may not have the scale to perform all functions efficiently in-house.
Conclusion
The break-even point is a critical financial metric businesses use to calculate the minimum units needed to sell to cover the costs. It’s the point where total costs (fixed and variable) equal total revenue. This calculation is crucial for business decisions, as it helps set pricing strategies, forecast sales volume, and manage product costs.
To learn more about various topics related to finance, accounting, and bookkeeping, visit the Akounto Blog section today.